Latest version: 4.3.x
Topology
Streaming Data platform application topology / application lineage:
Basic Concepts
The Topology is a rich UI that enables the visualization of detailed Data Flow Graphs, ETL Pipelines
Stream Processing and Analytics workflows and their relation to native Lenses/Kafka resources, such as
Kafka Topics, SQL Processors, and Kafka Connectors.
External Applications
On top of that, we can visualize External Applications in the Topology, whether that is your Java Kafka Stream applications, Apache Flink or Spark Jobs, or Microservices written in any programming language.
Metrics
Lenses Topology has built-in support for overlaying metrics for each entity. You can now monitor “Input” and “Output” Rates for Records and Data, as well as the “Status” of the Application in question. You can configure the frequency of the metrics received via the configuration
API
If you are unfamiliar with our RBAC Security, you can find more on Application Permissions
here
.
You can use either the Lenses HTTP API or the JVM Topology Client Library to instrument your custom applications.
HTTP Client
Register Custom Applications, with the HTTP Client, and metadata for their usages, following the instructions in this
example
.
The HTTP Topology API provides a full HTTP Lifecycle. You can find more info
here
.
JVM Client
If you are developing a JVM based Application, you can take advantage of or JVM Topology Client Library. Learn how to Register an Application by following this example . You can also include Metrics with the JVM Topology Client, following the instructions here .
CLI
You can find more about Lenses GitOps capabilities, following the instructions here
UI
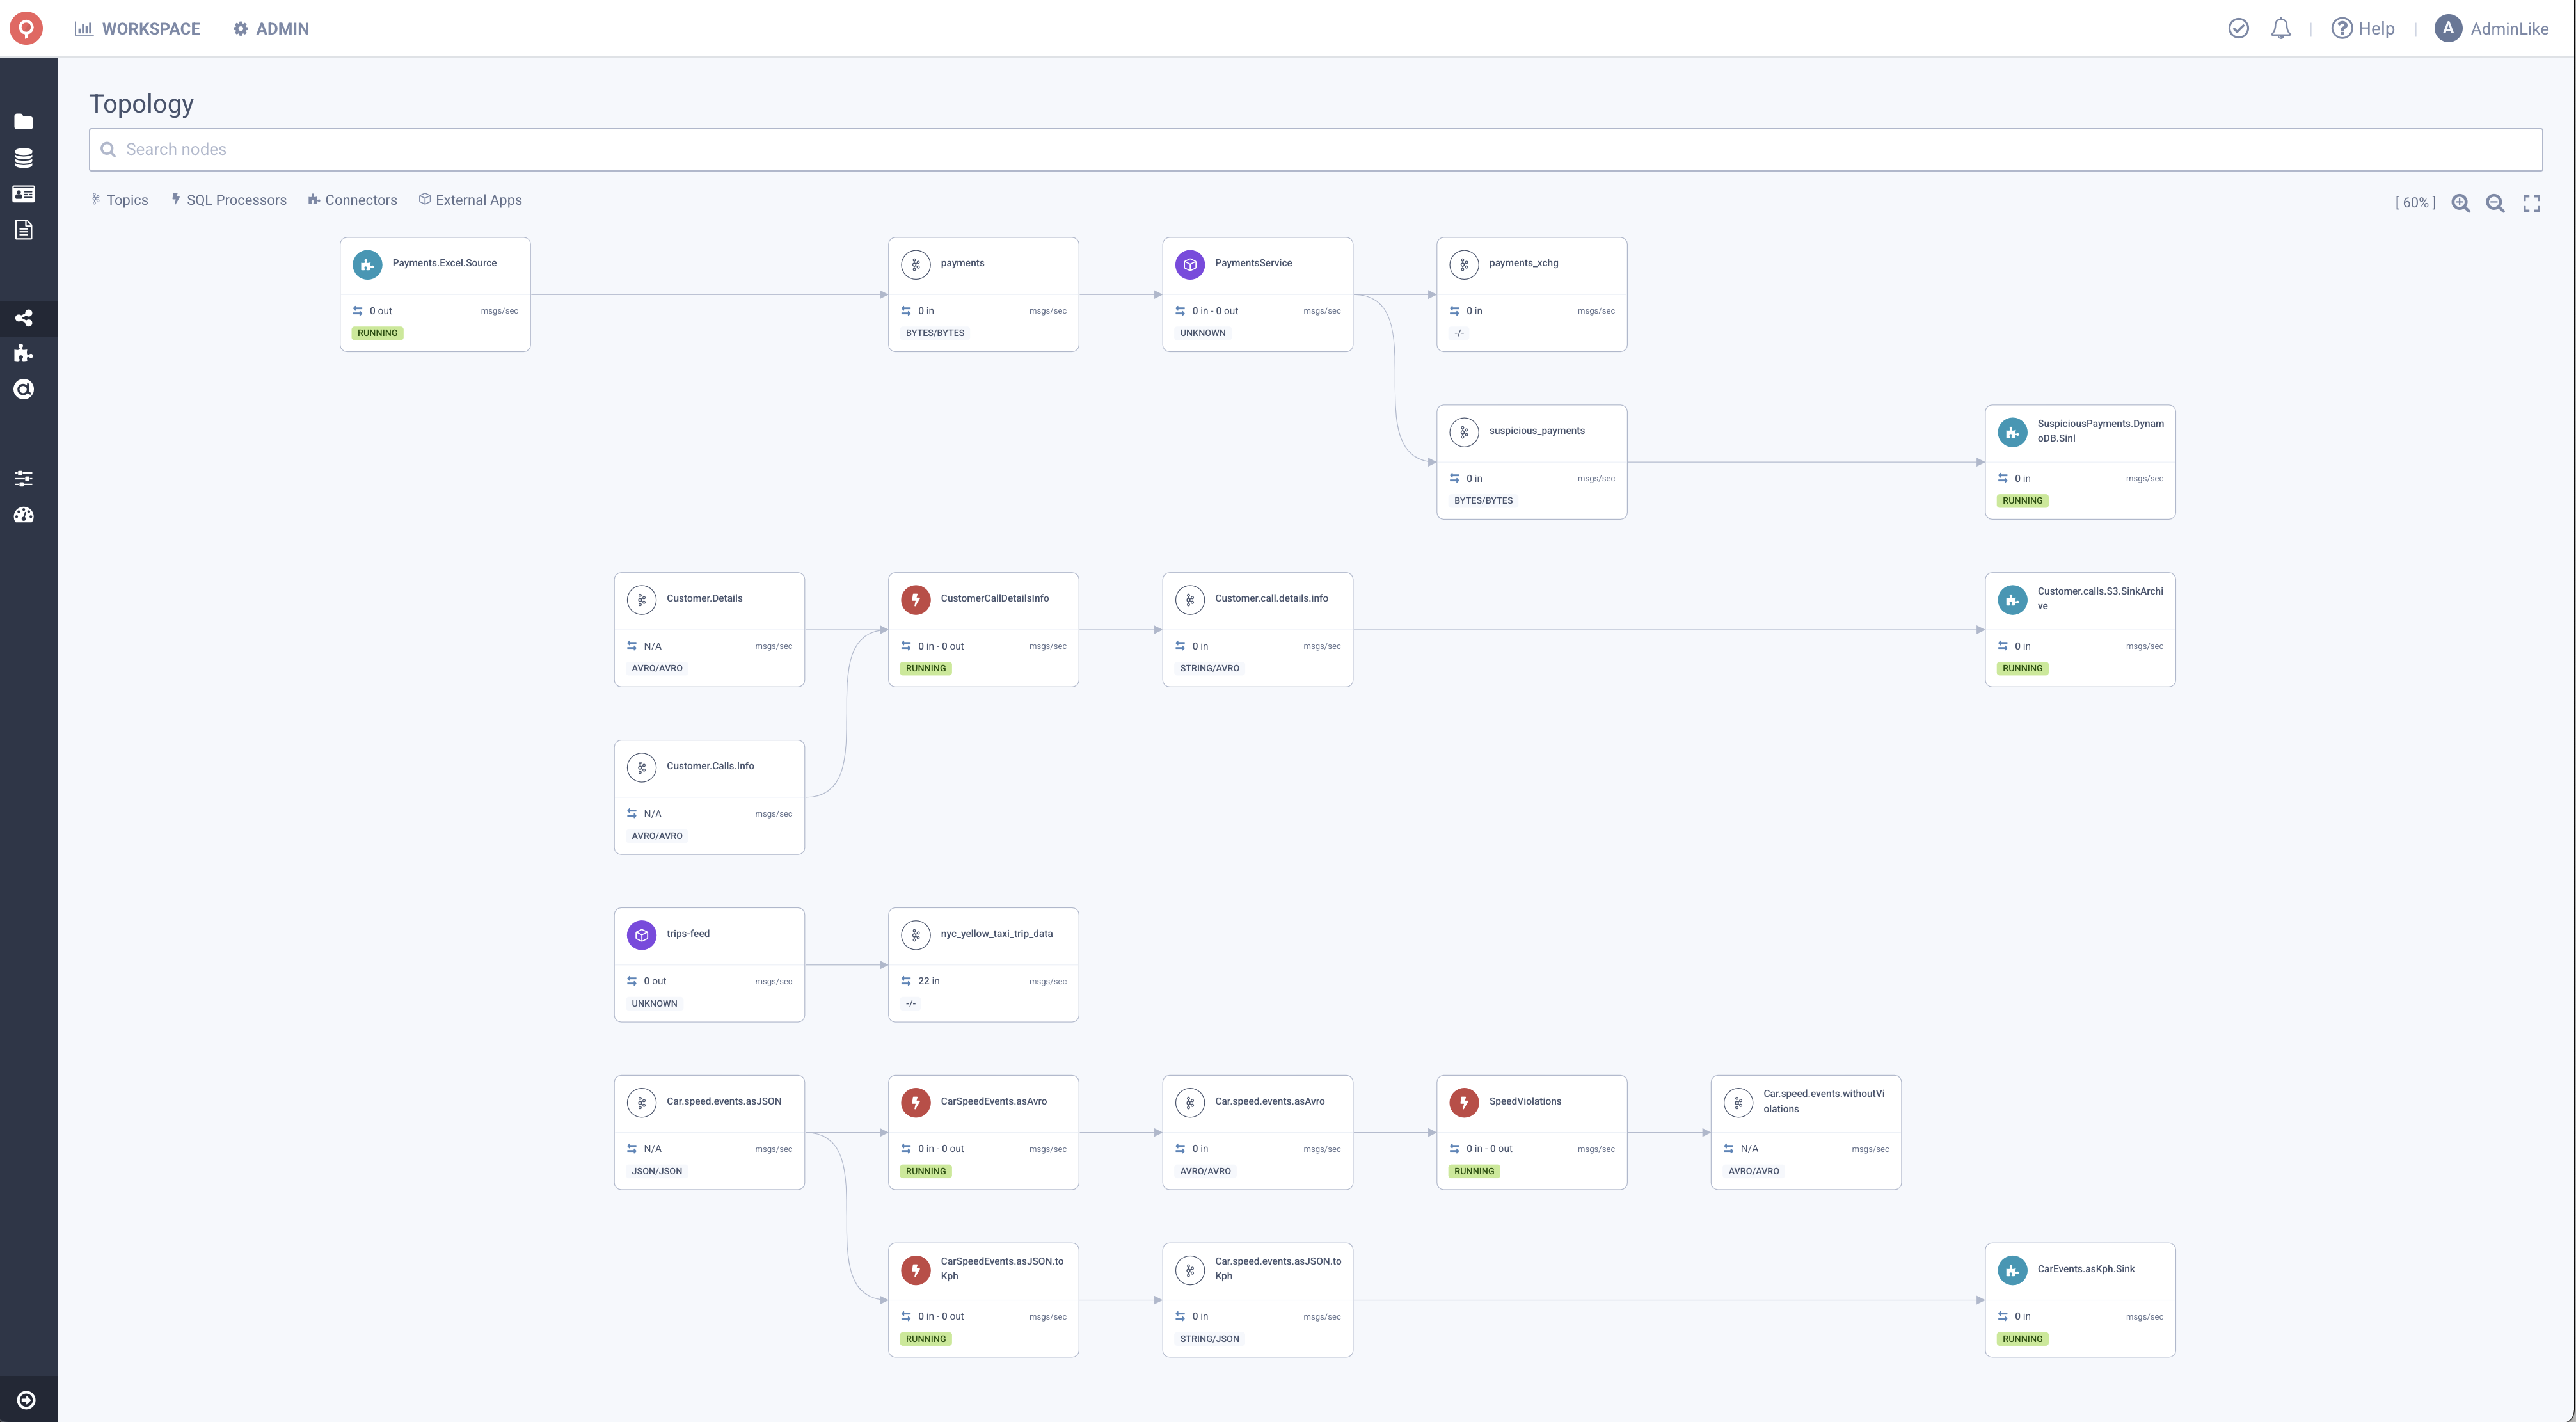
Lenses Topology is comprised of several different Nodes Types. From Topics, SQL Processors, and Connectors, to Custom Application.
Each Node on the UI is clickable. That way, we can take a close view and look for more information regarding each Node.
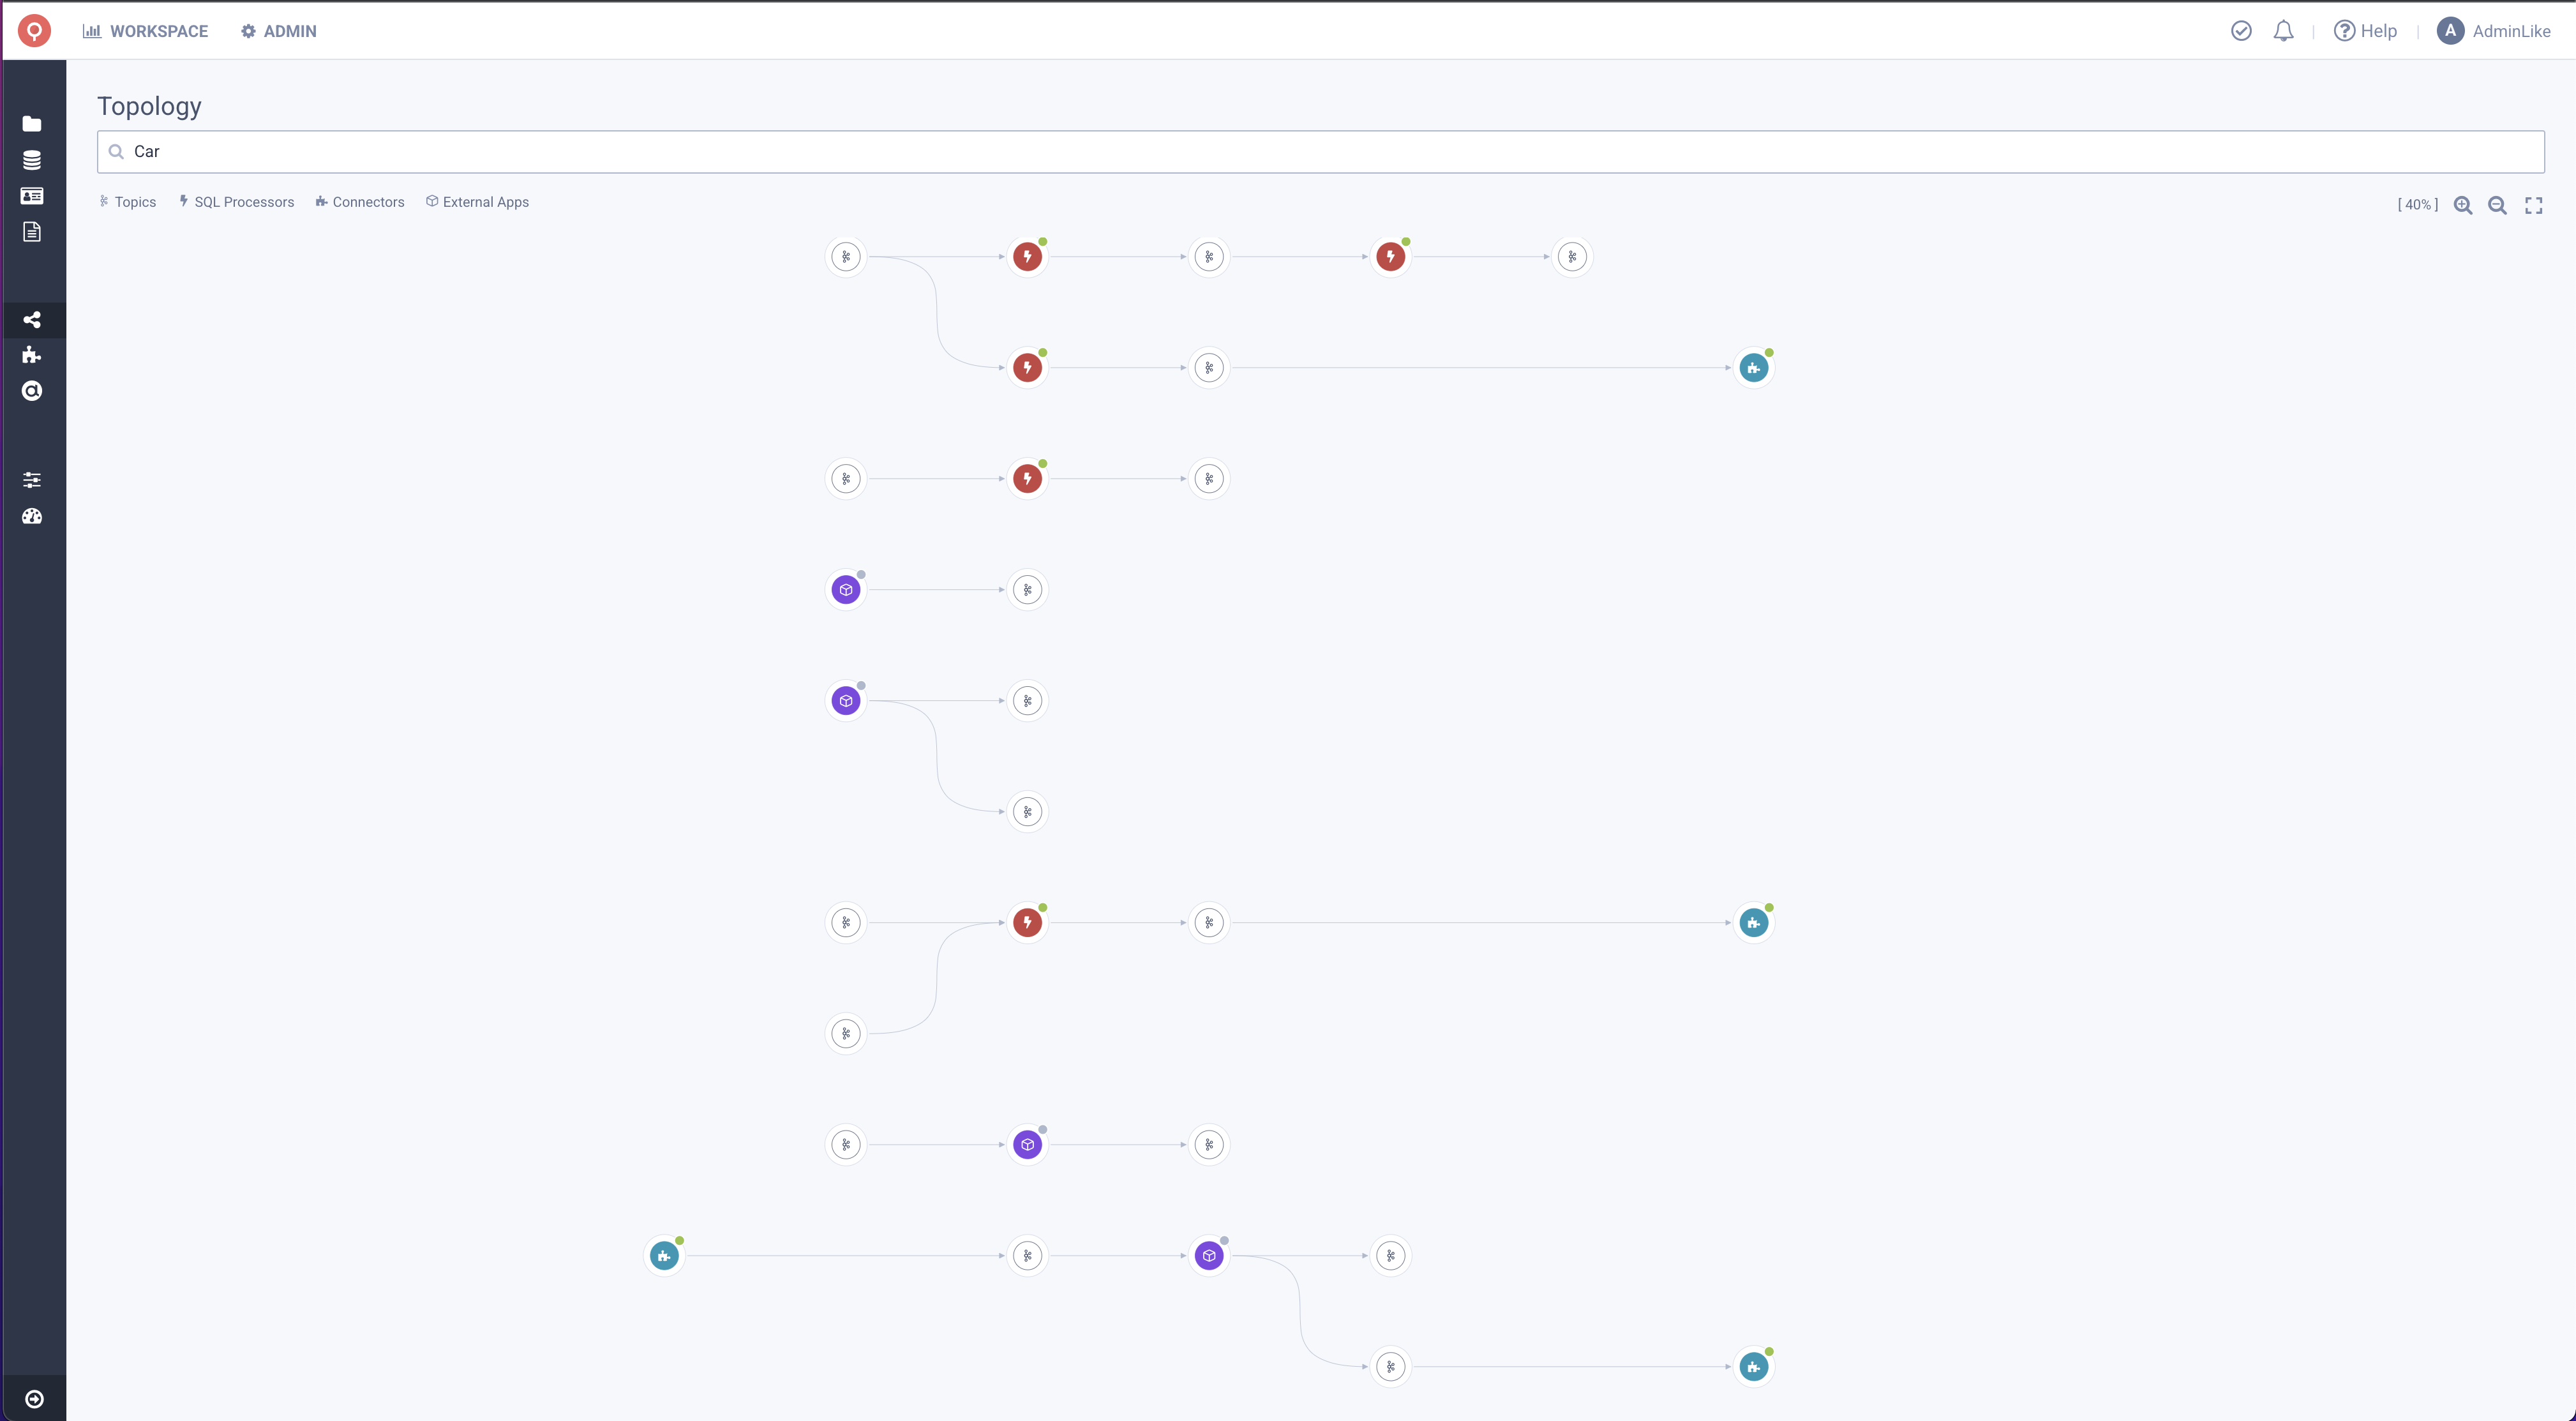
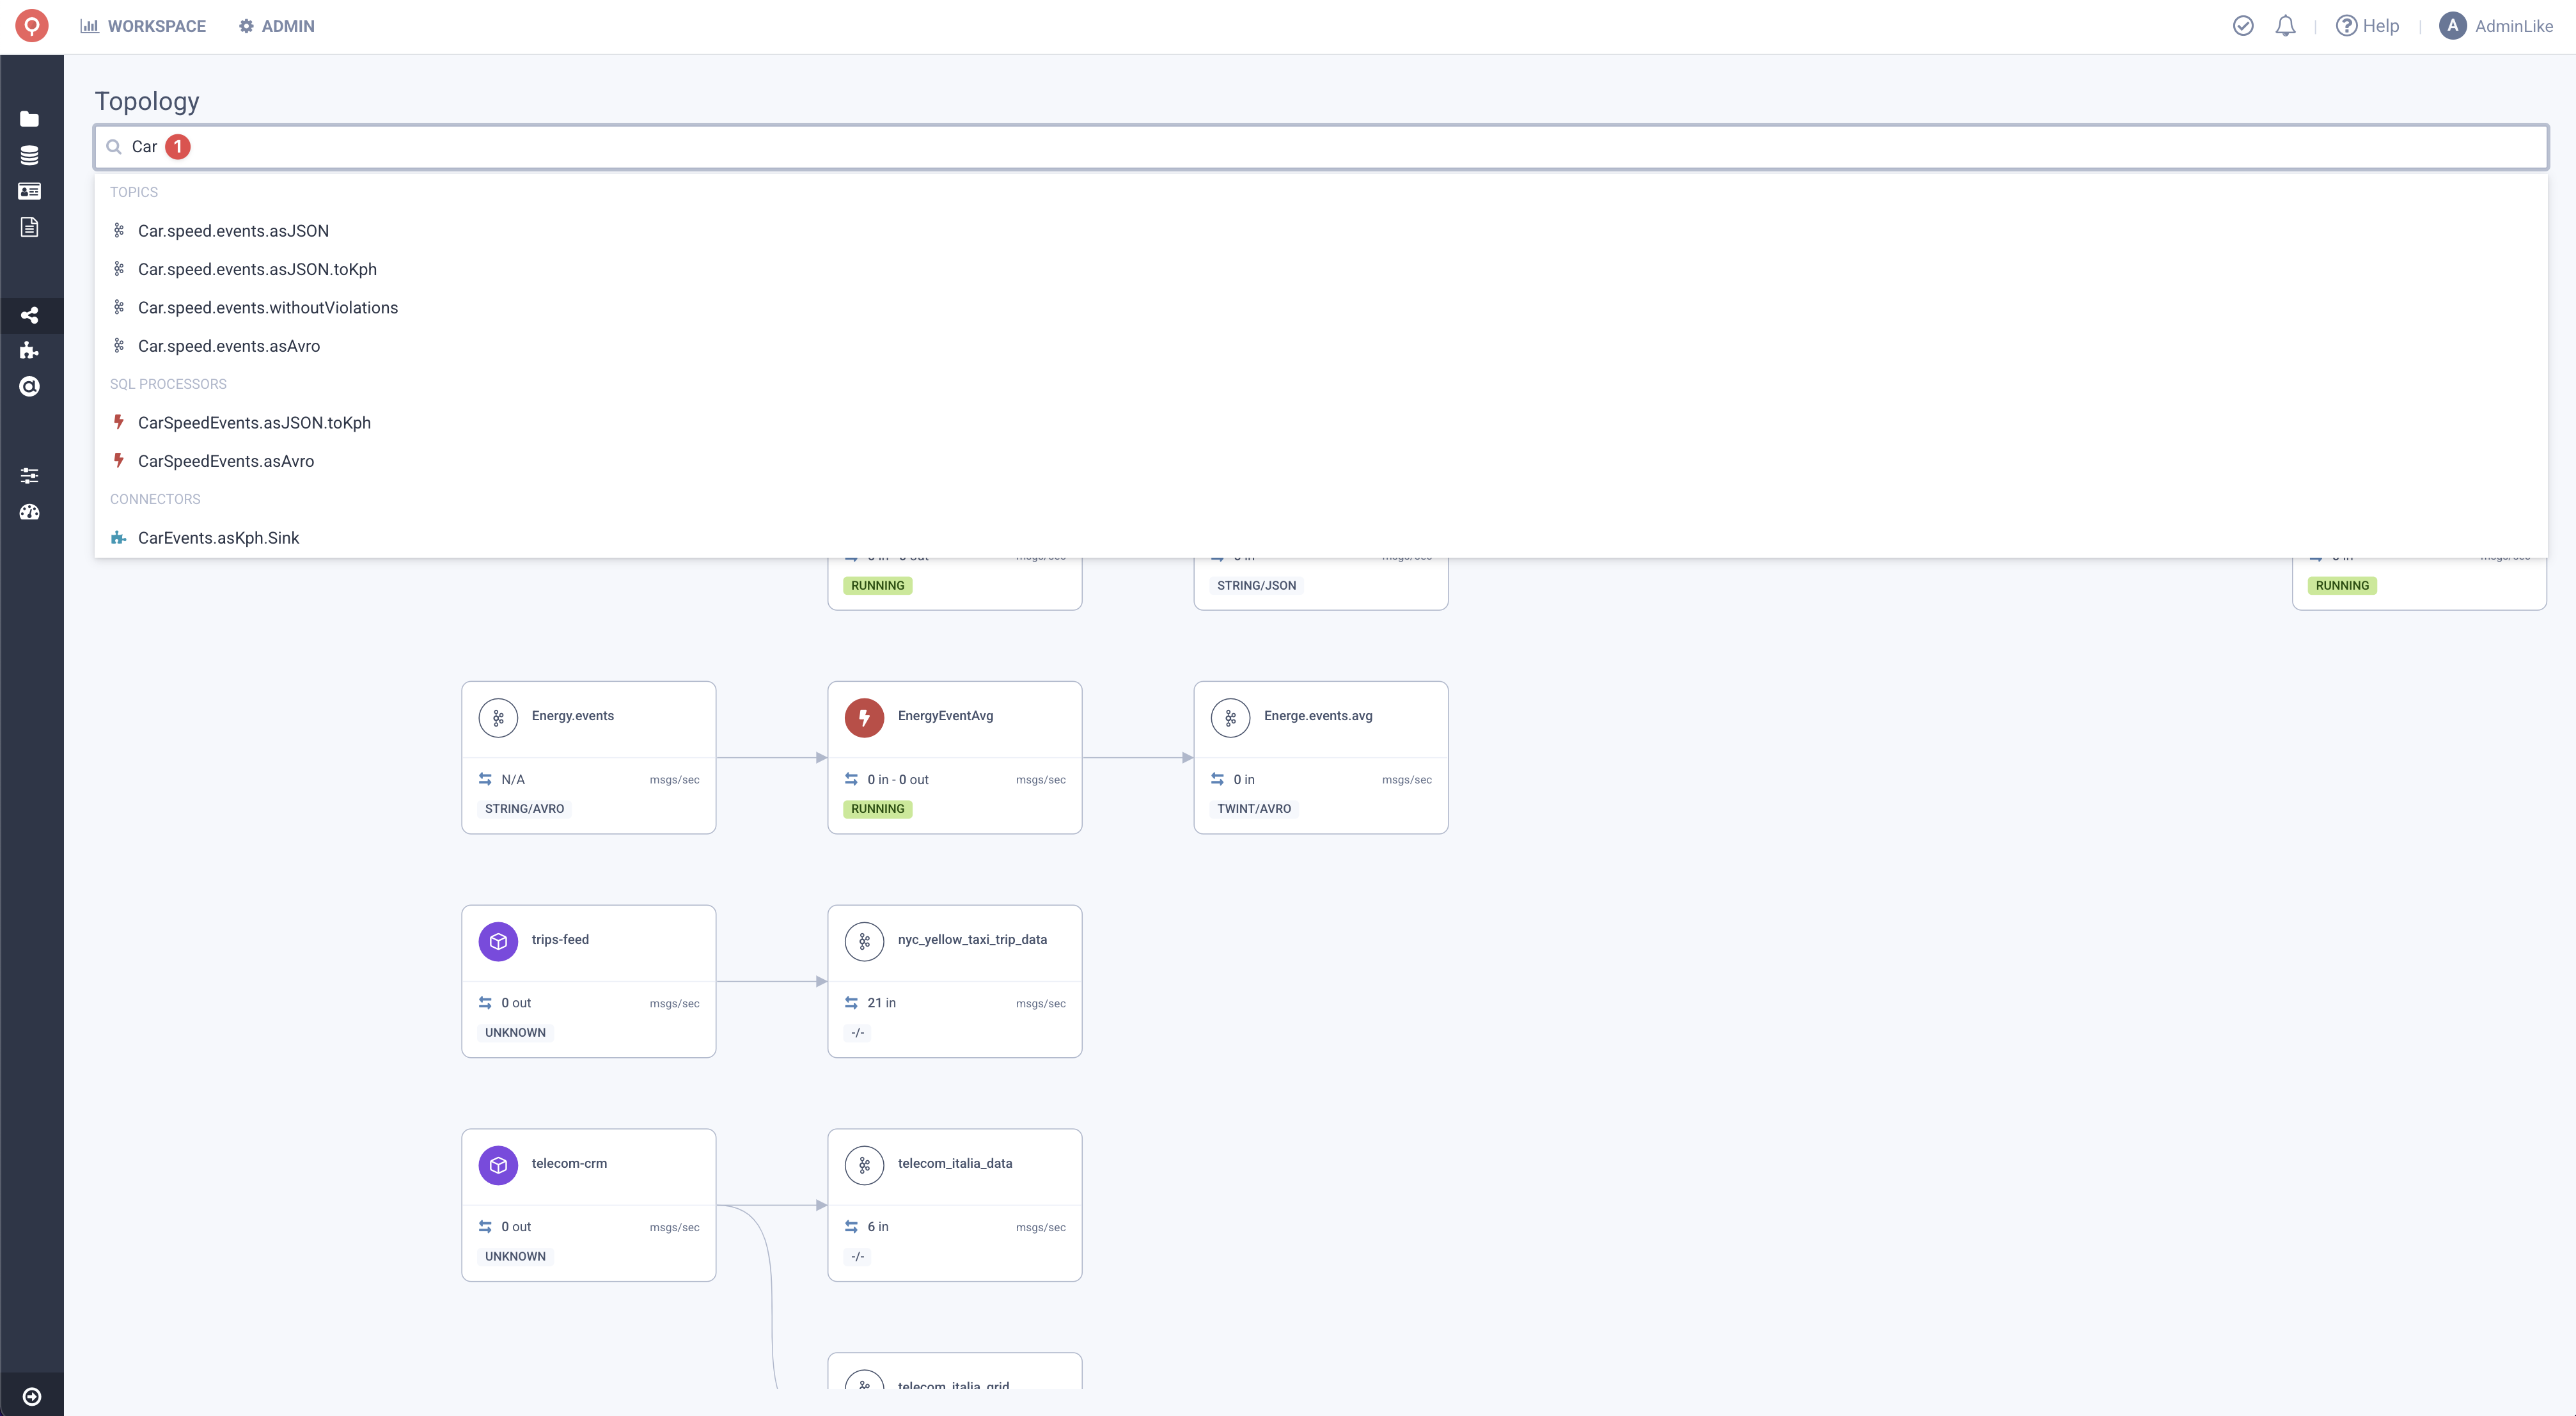
Search and Select
Topology screen allows for Search in the Nodes by Node name which helps navigation in bigger application landscapes. We categorized the Nodes, based on their type(i.e: SQL Processors, Connectors etc.) for easier identification.
Kafka Topics
Kafka Topics, are “stores” on information. In the Topology, they are depicted as folders, and by clicking them we can see more information,
about their usages as described in the image below:
- Information about the Topic (Replication, Partitions, Configs, Schema Format).
- Information about (Producers, Consumers) and Quick Links to them.
- Information about (Metrics) such as Rate In/Out and Data Size.

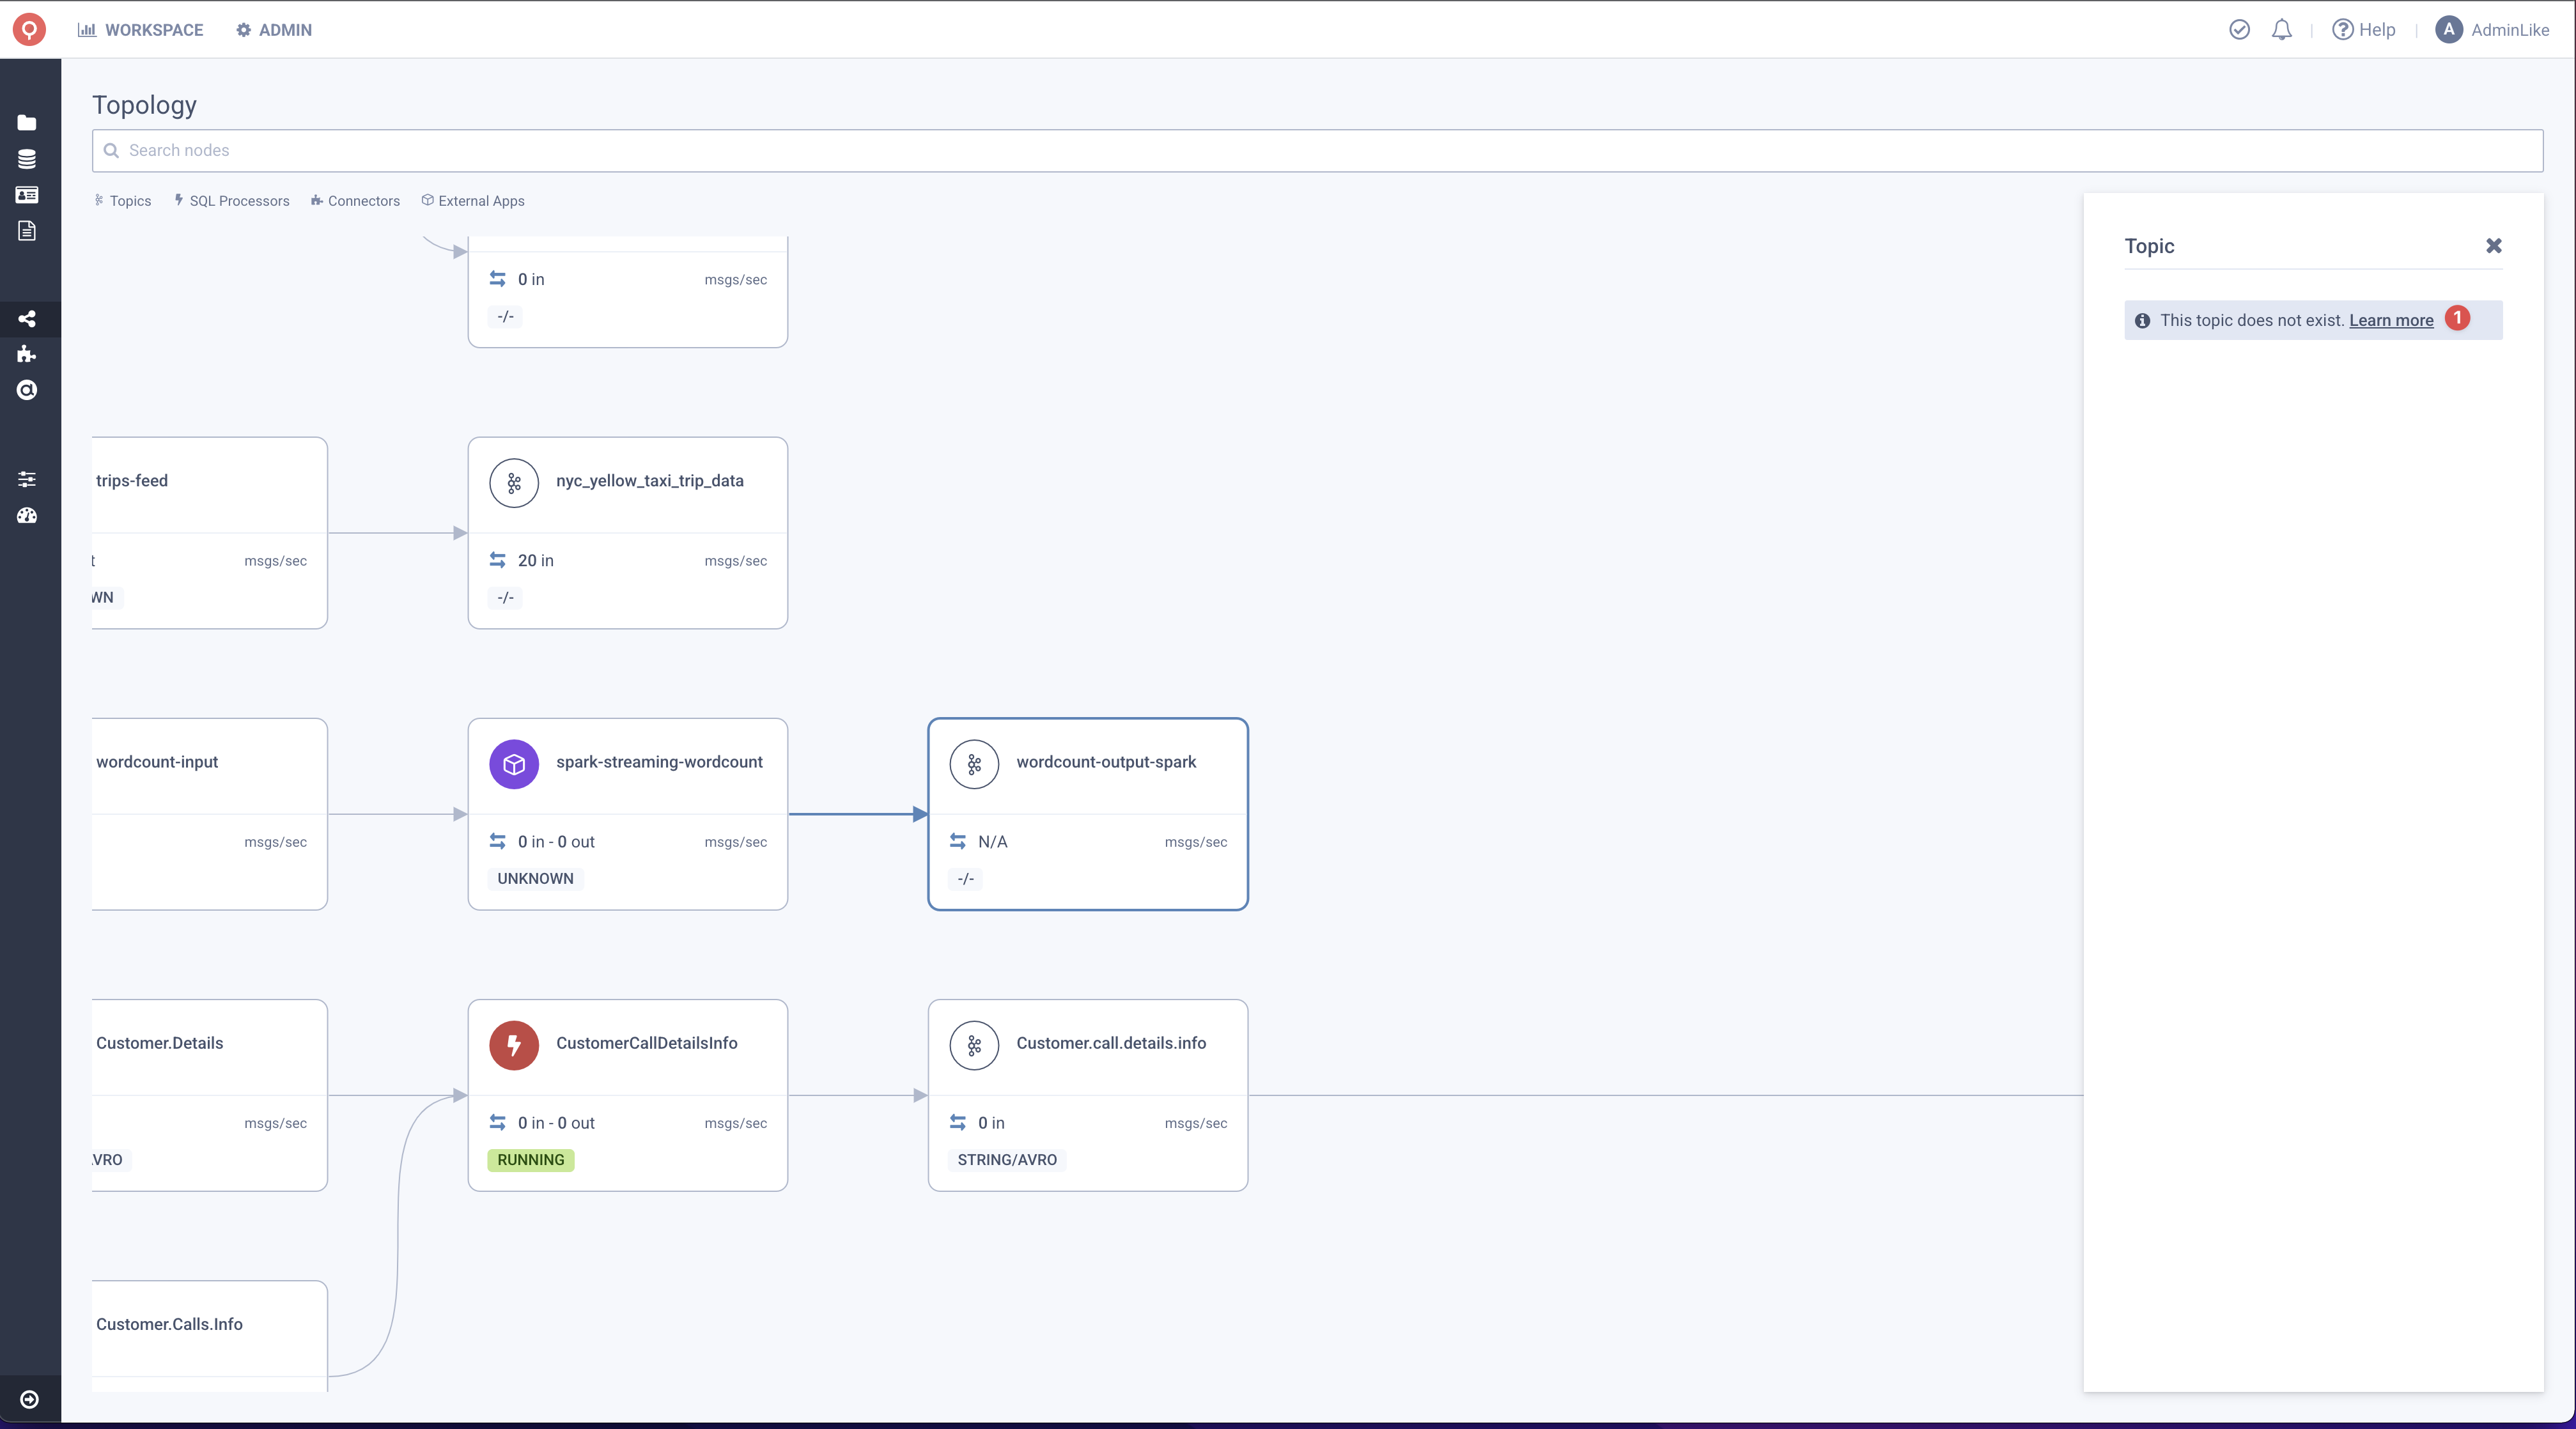
SQL Processors
Lenses SQL Processors, allow you to use Streaming SQL to process real-time data. In the Topology, they are depected with a Thunder icon. By
clicking them, we can see information such as:
- Information about the Processor (Status, Runners).
- Information about (Metrics) such as Rate In/Out and Data Size.
- Information about the (Inner Topology of the Processor, SQL Statement).

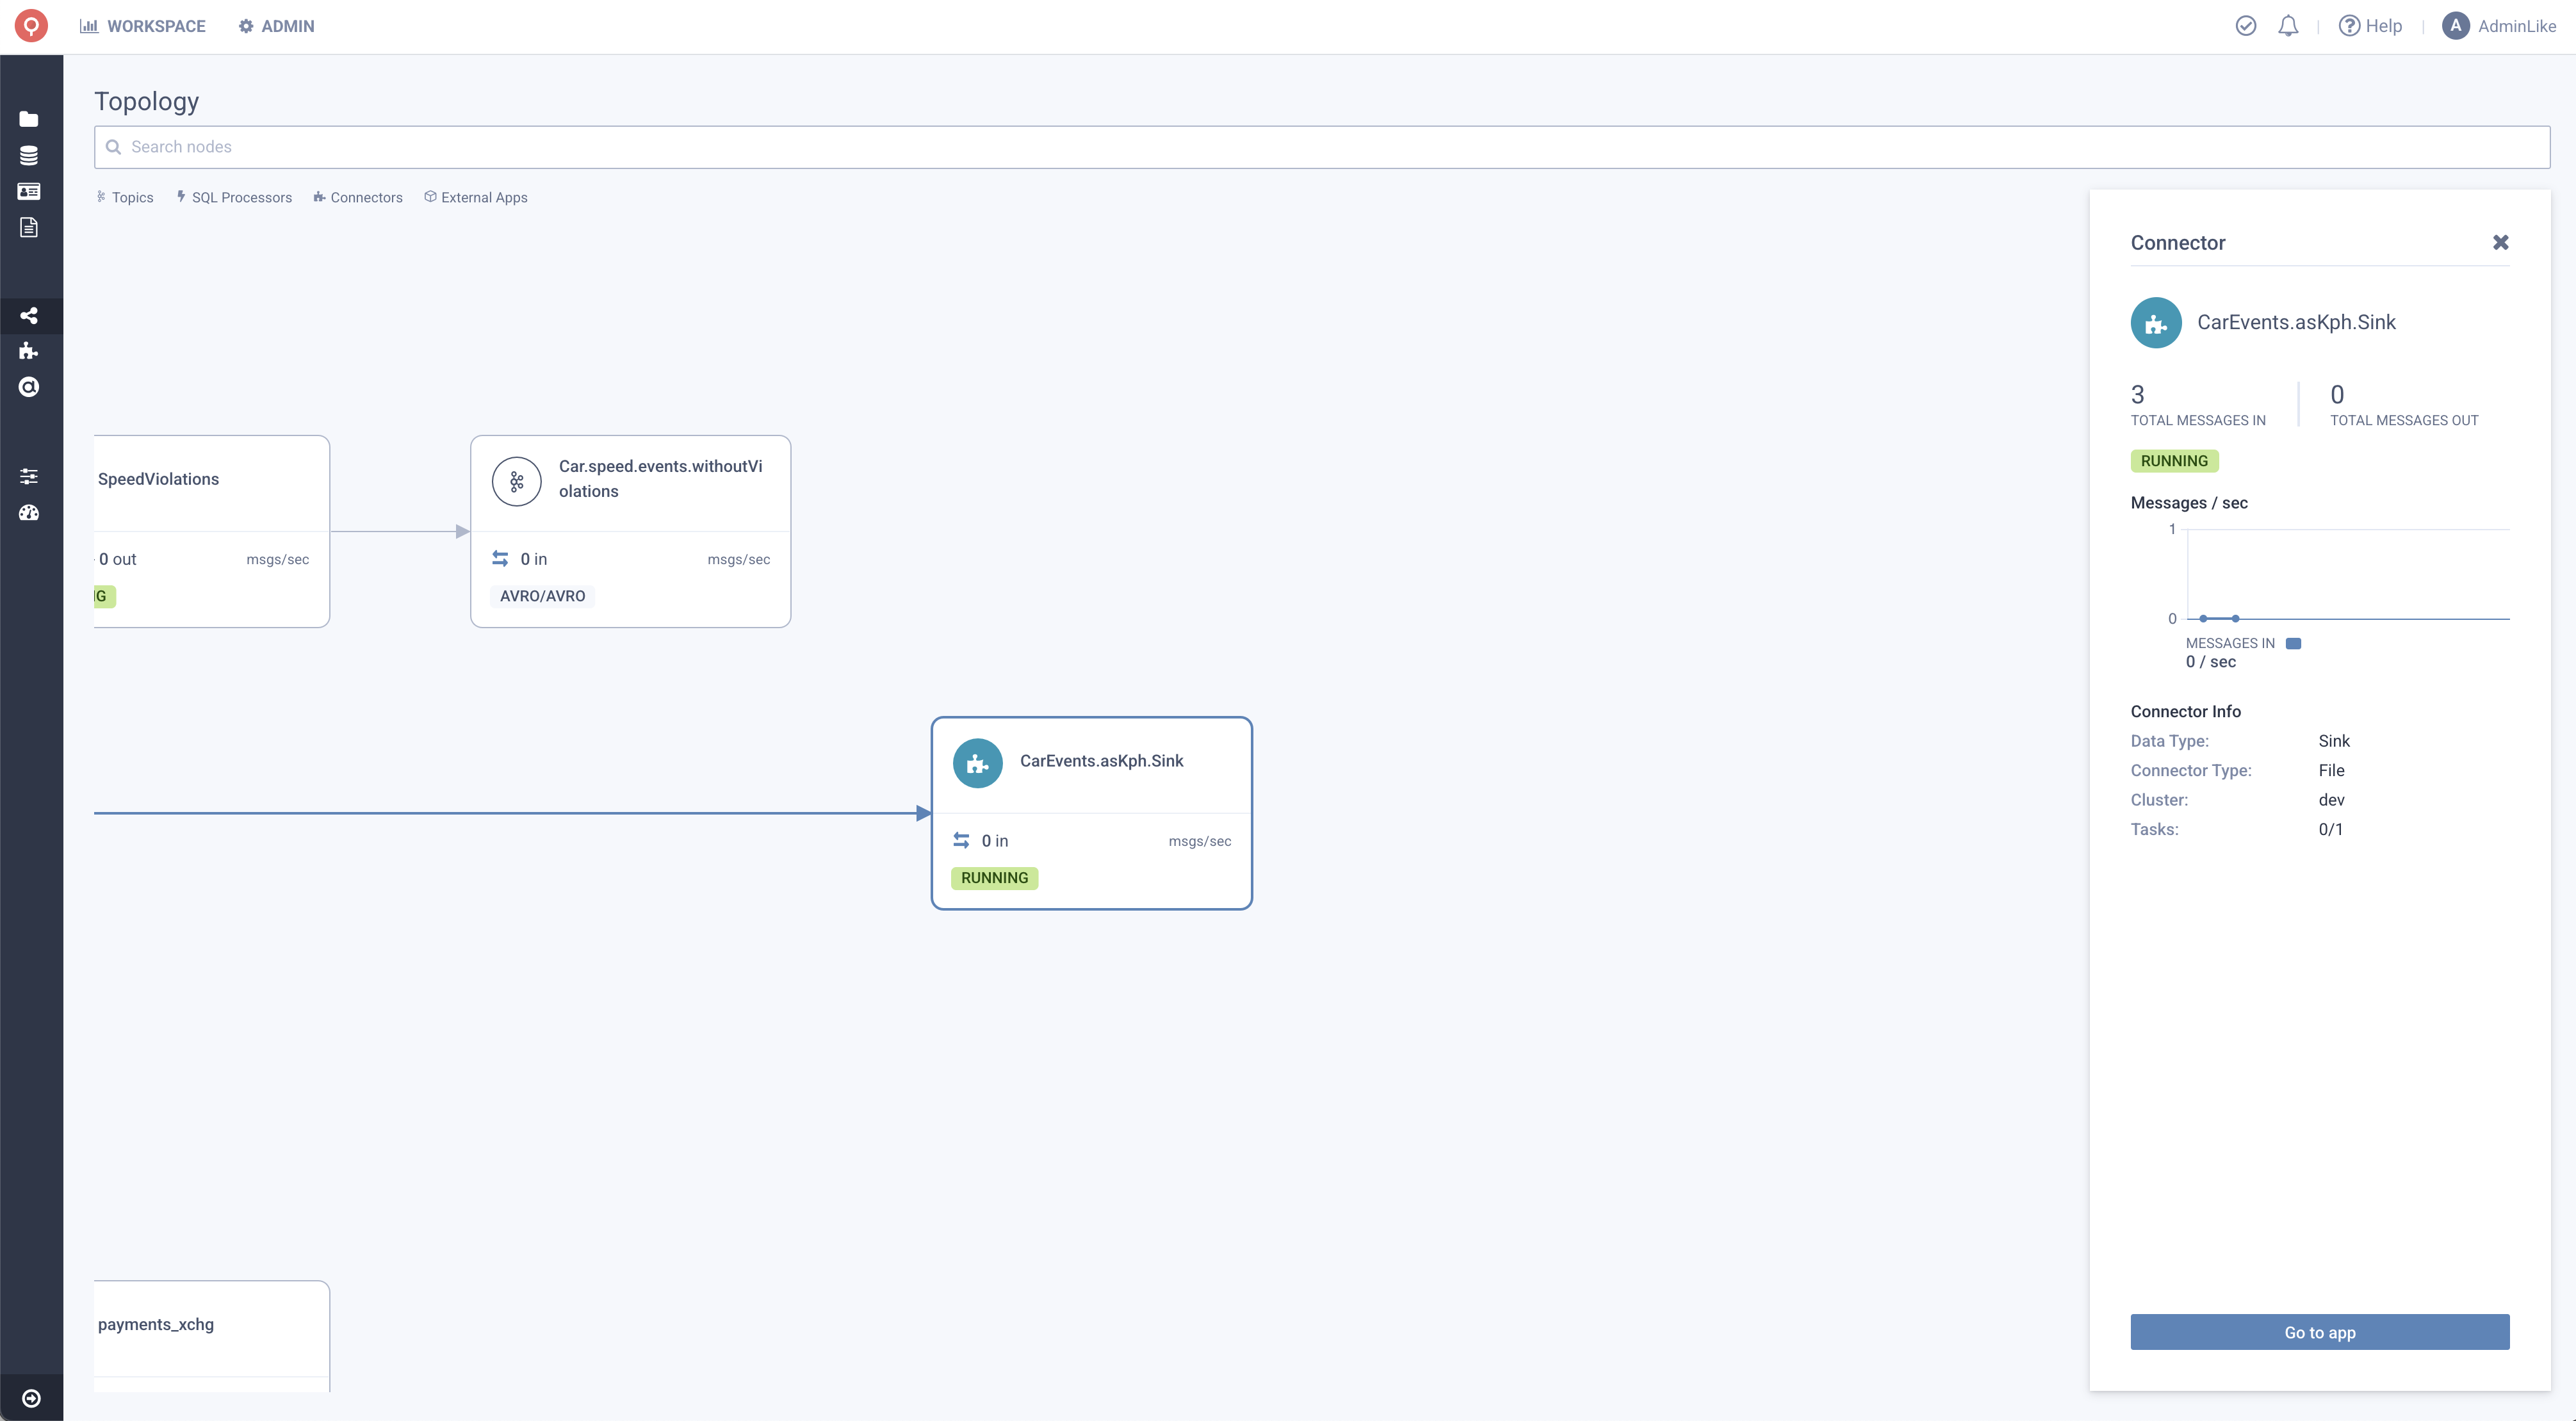
Kafka Connectors
Connectors, are used to either import or export Data to and from your Kafka Cluster. They are represented in Lenses Topology as Puzzle icon. By
clicking them, we can see information such as:
- Information about the Connector (Status, Data Type, Number of Runners).
- Information about the Connector Taks (Task Status, WorkerId).
- Information about the Topics used (Name, Quick Link).
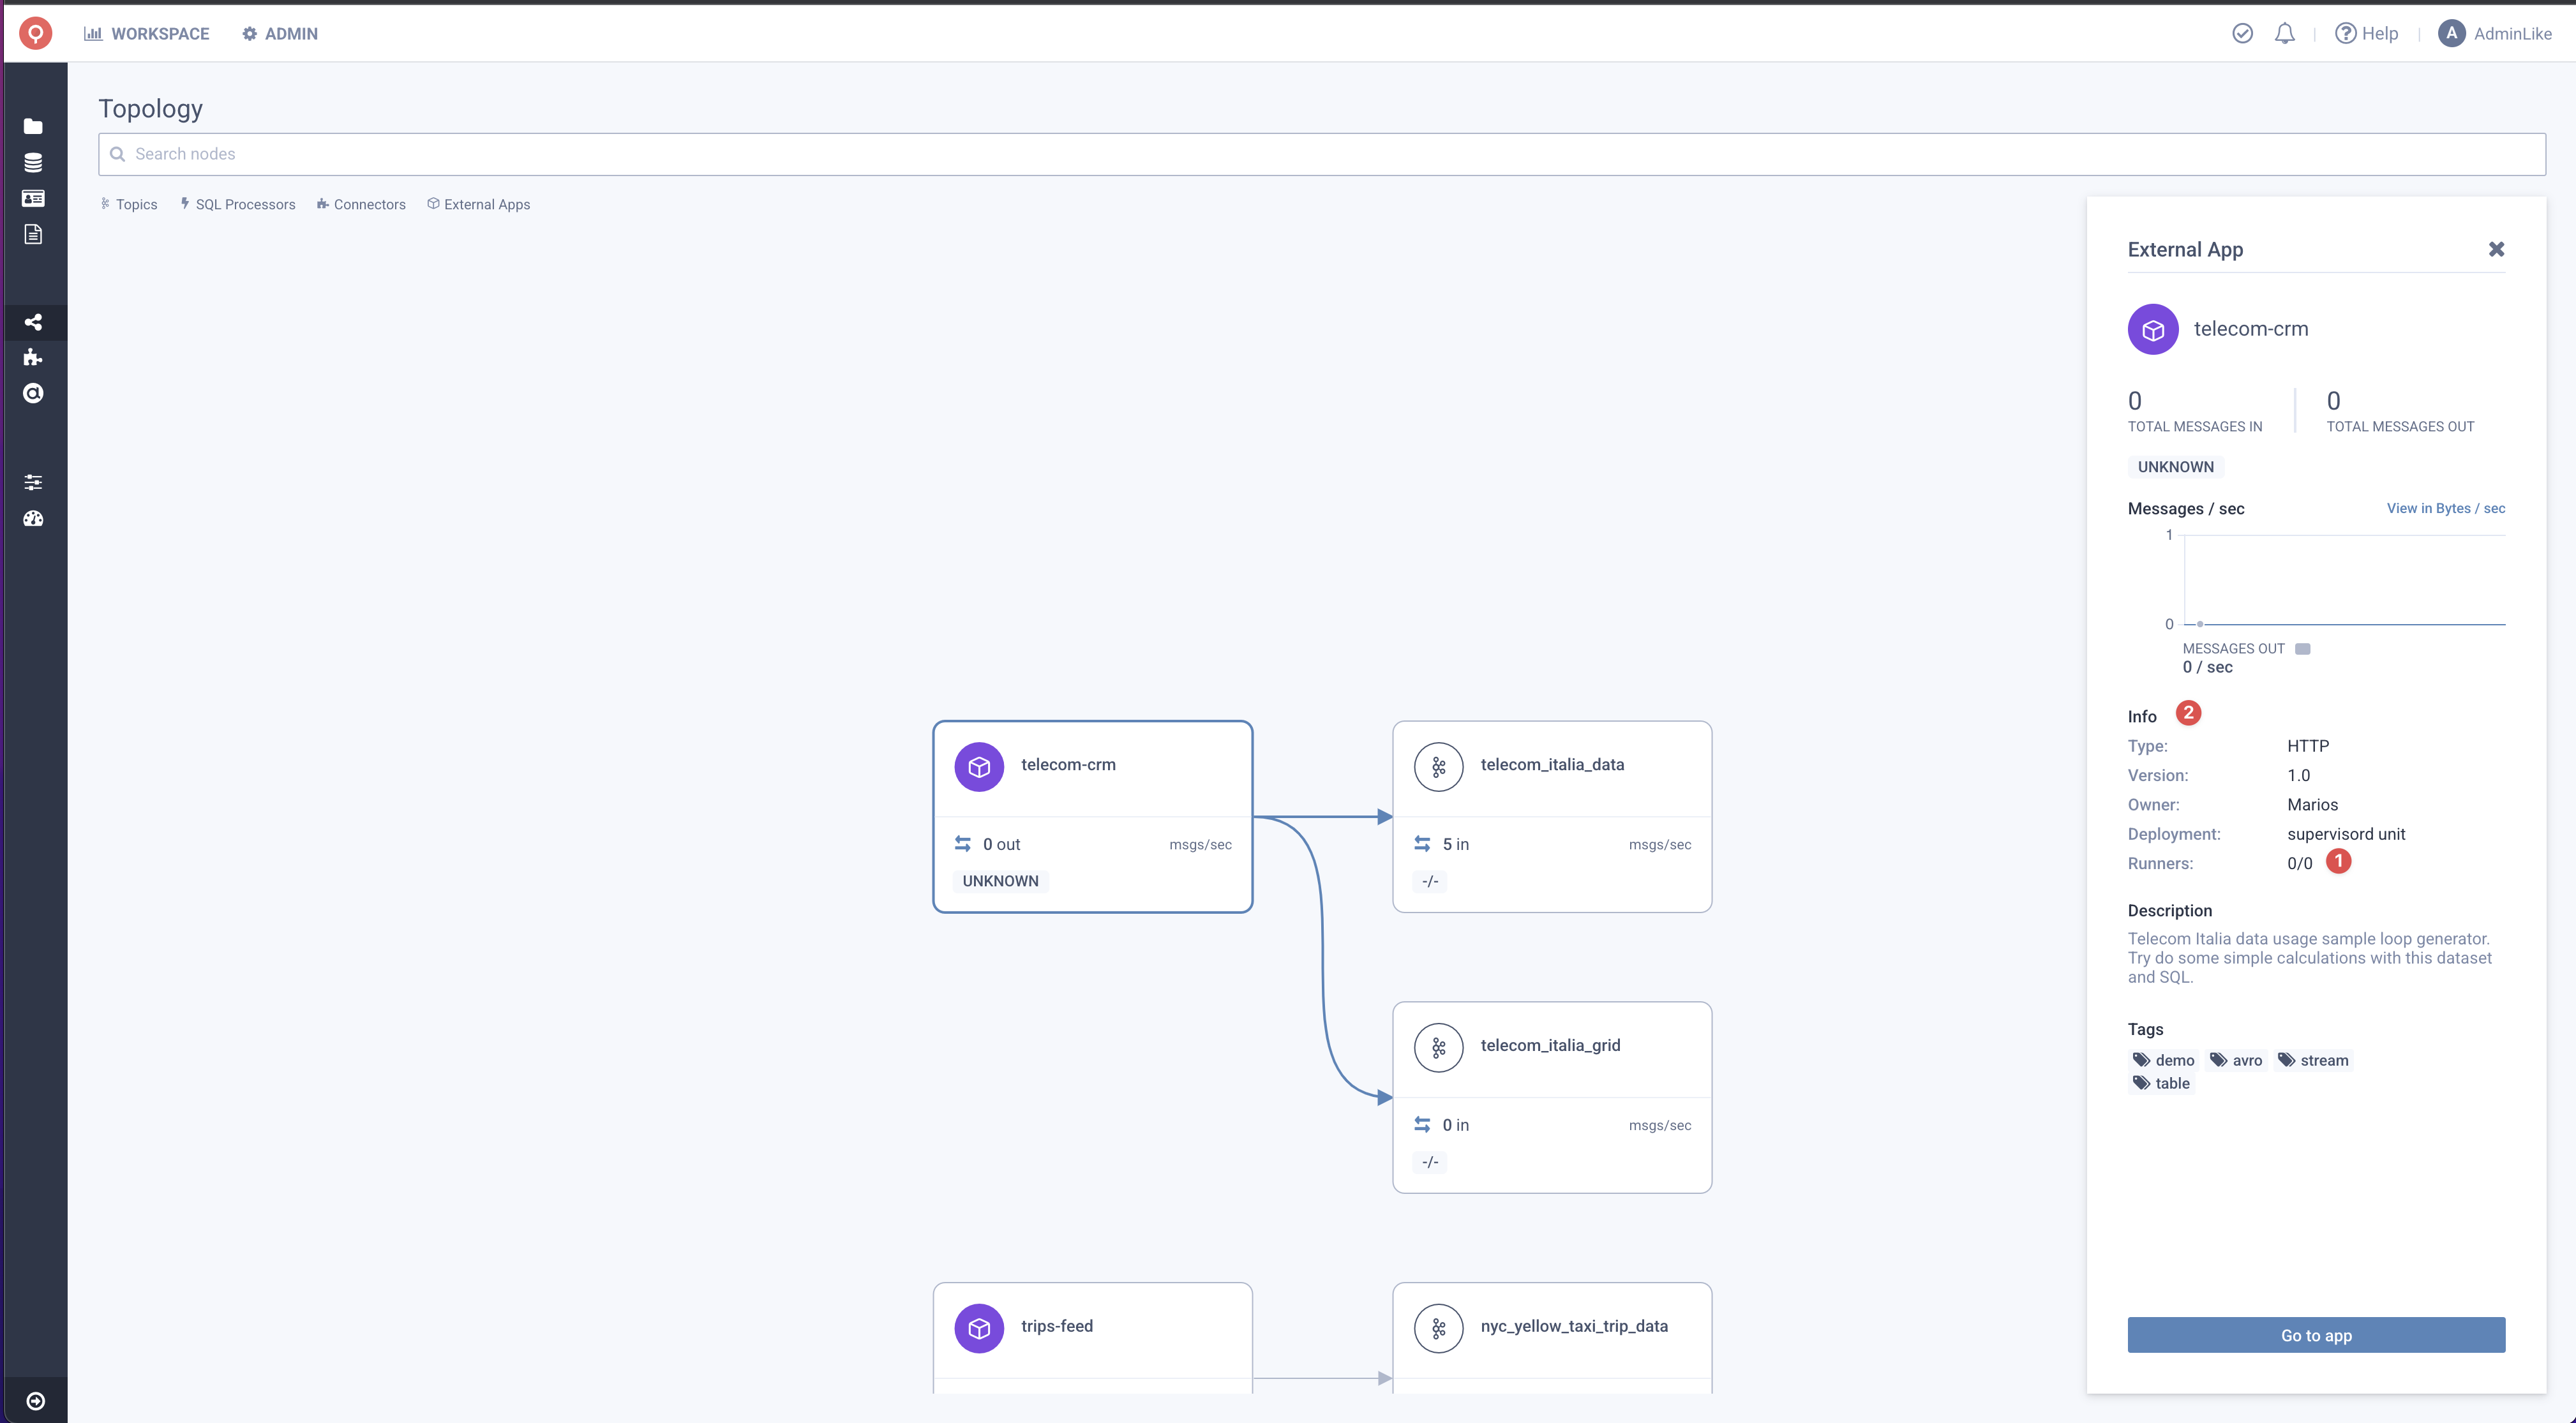
Custom Applications
Applications deployed outside of Lenses can be registered Lenses’ Topology. They are presented with a Lenses App icon. By clicking them, we can see
information such as:
- Information about the Application Status (Status, Runners).
- Information about the Application (Owner, Deployment, Tags).