Latest version: 4.3.x
Grafana and Prometheus
Lenses monitors in real-time your Streaming Data Platform and your Kafka cluster and will raise alerts for any significant metric degradation, such as consumer lag, offline or under-replicated partitions and producer SLAs. However, it does not store the metrics for historical analysis.
Lenses integrates with Prometheus and Grafana to export, store and visualize metrics for your cluster and applications.
Lenses ships with a set of pre-defined templates, that use:
- A Time Series database (Prometheus)
- Custom JMX exporters
- A Data Visualization application (Grafana)
- Built-in domain intelligence about operating Kafka with confidence in production.
Setup the monitoring suite
Follow the steps in the Lenses reference documentation .
Grafana dashboards
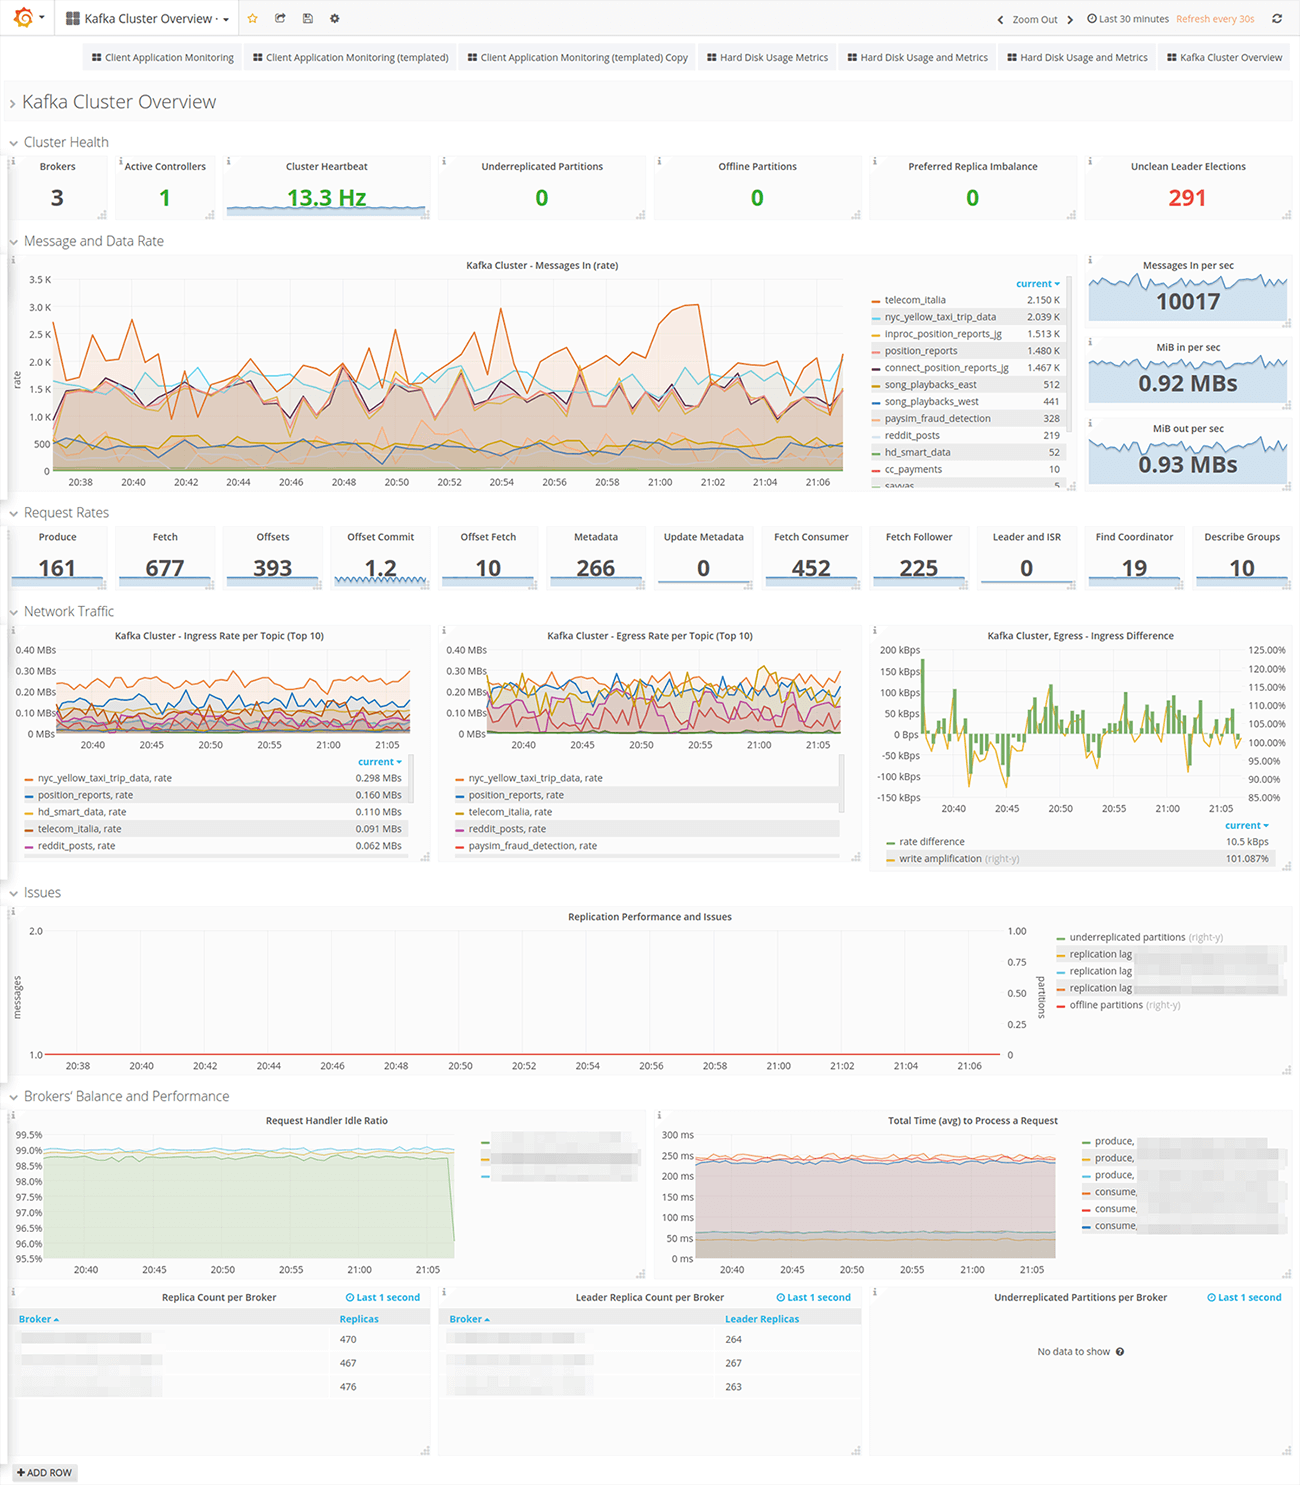
Kafka cluster metrics
A 360-degree of the key metrics of your Kafka cluster is curated into a single template that allows time travel between the past 60 days (by default) of key metrics and pro-actively receives alerts and notifications when your streaming platform is under pressure or signals of partial failures appear.
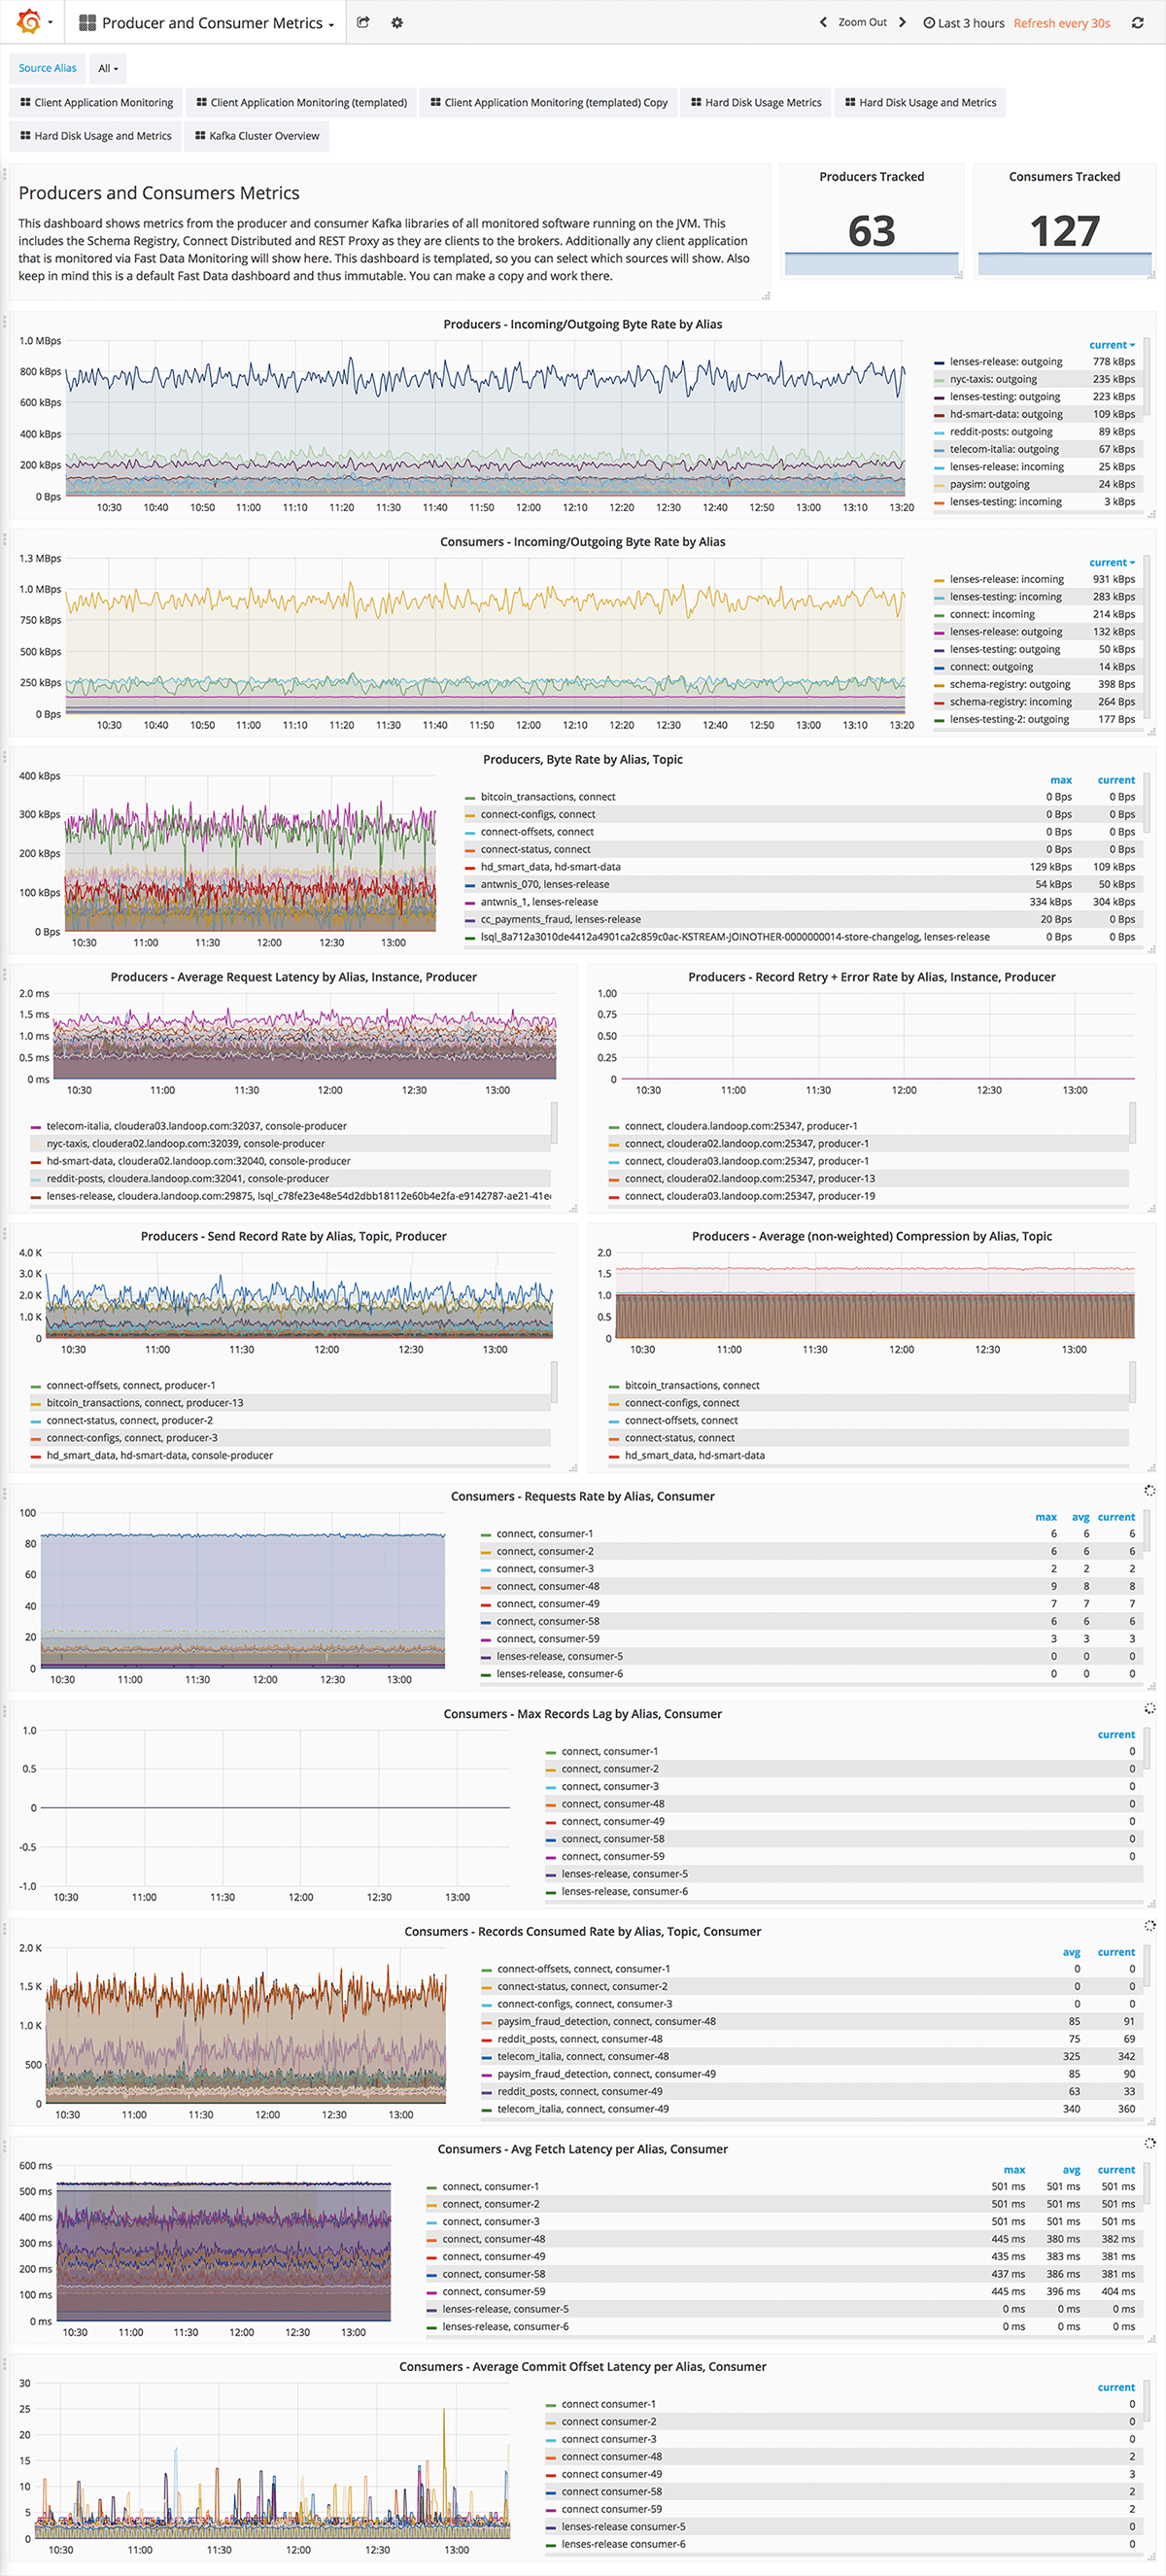
Consumer producer metrics
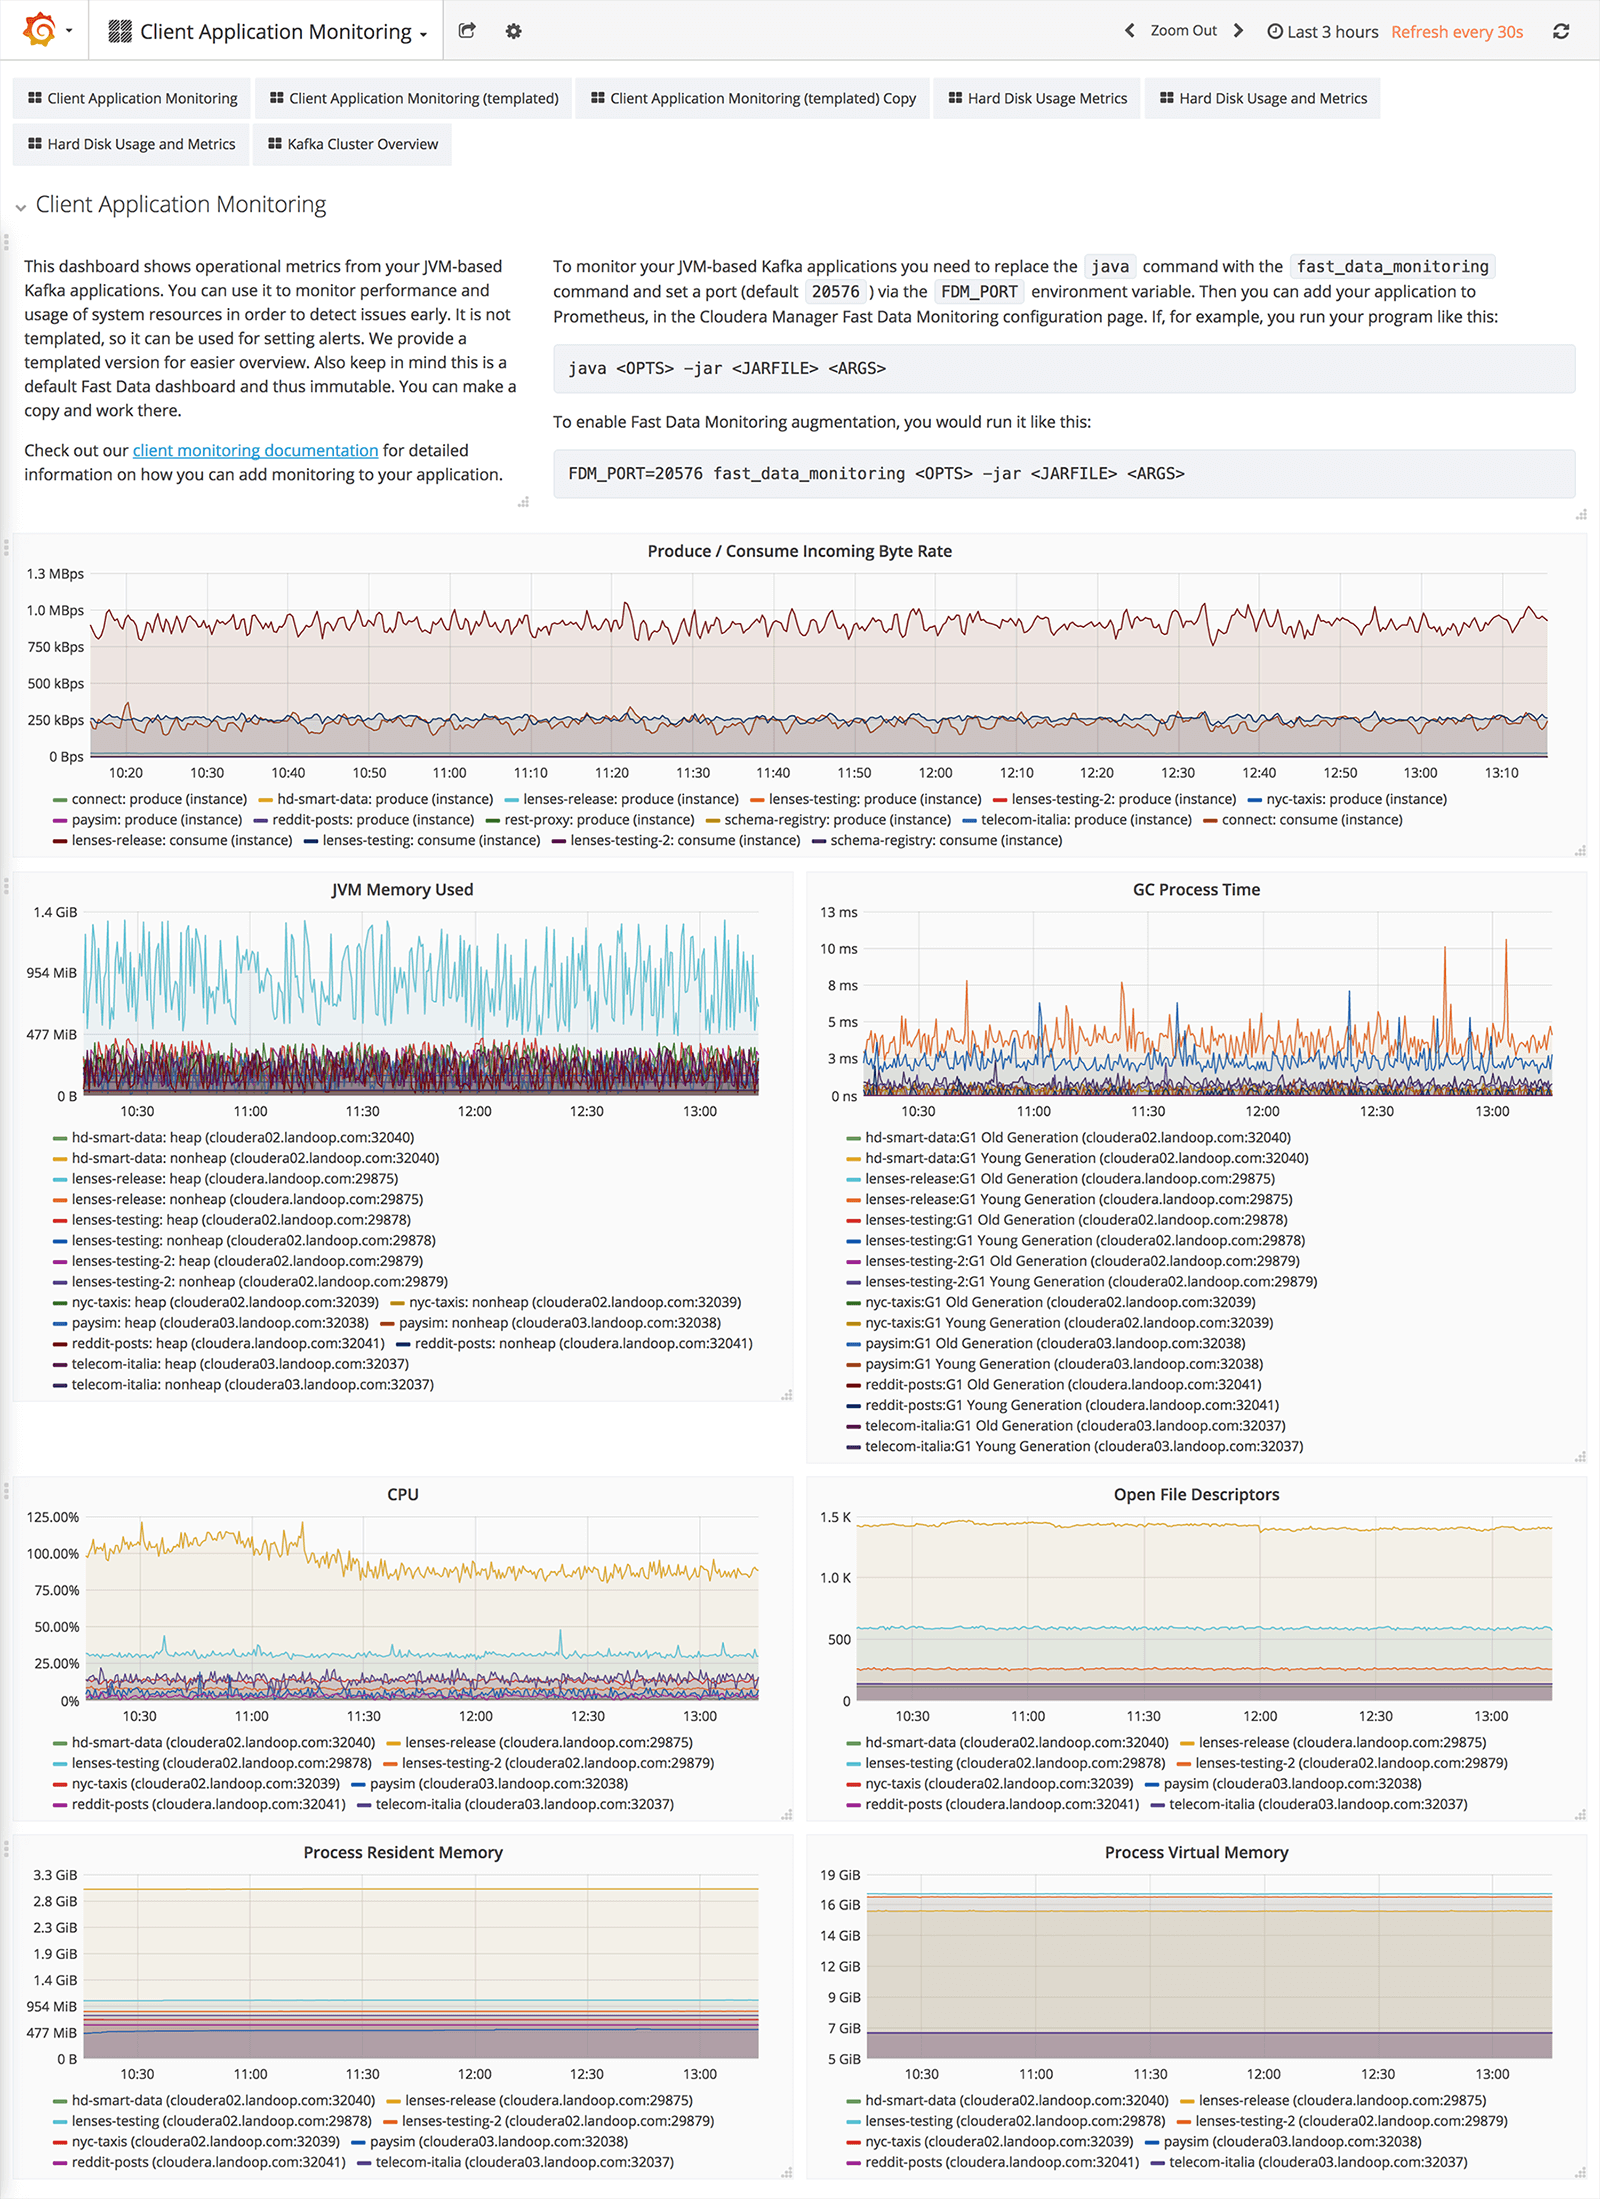
Client application metrics
These are operational metrics from your JVM-based Kafka applications. You can use it to monitor system resources’ performance and usage to detect issues at an early stage. It provides full access to how JVM apps and the Garbage Collector behaves, as well as how to open file descriptors and other critical aspects of your applications.
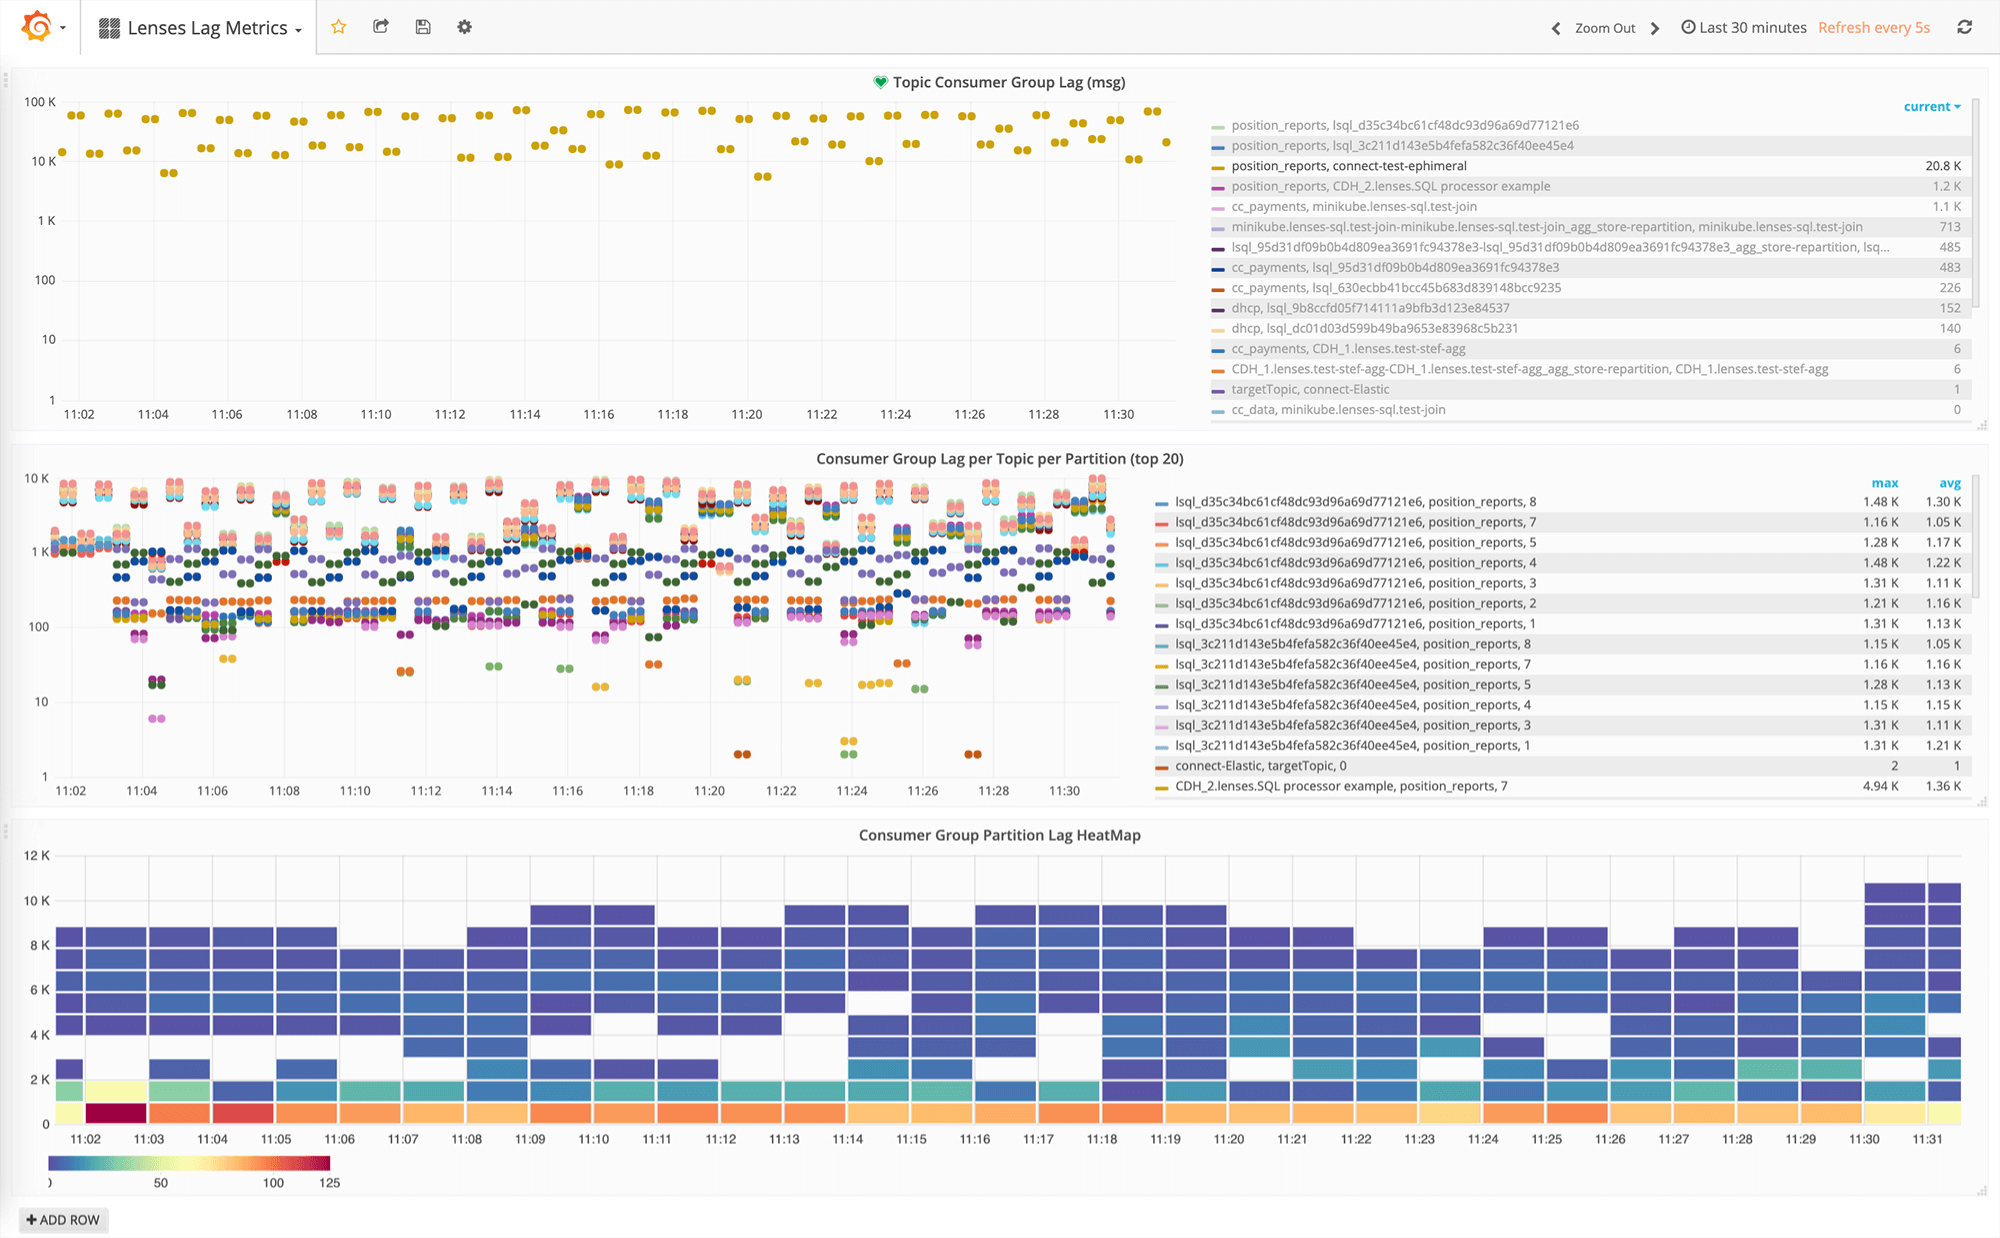
Consumer lag